Usage Examples
The examples below show GeoCAT-comp functions being utilized in real-world use cases. They also demonstrate how GeoCAT-comp can be used to make plots with Matplotlib (using Cartopy) and PyNGL (work in progress).
Data files
The data files used in these examples can be downloaded from the NCL website.
GeoCAT-comp with Matplotlib and Cartopy
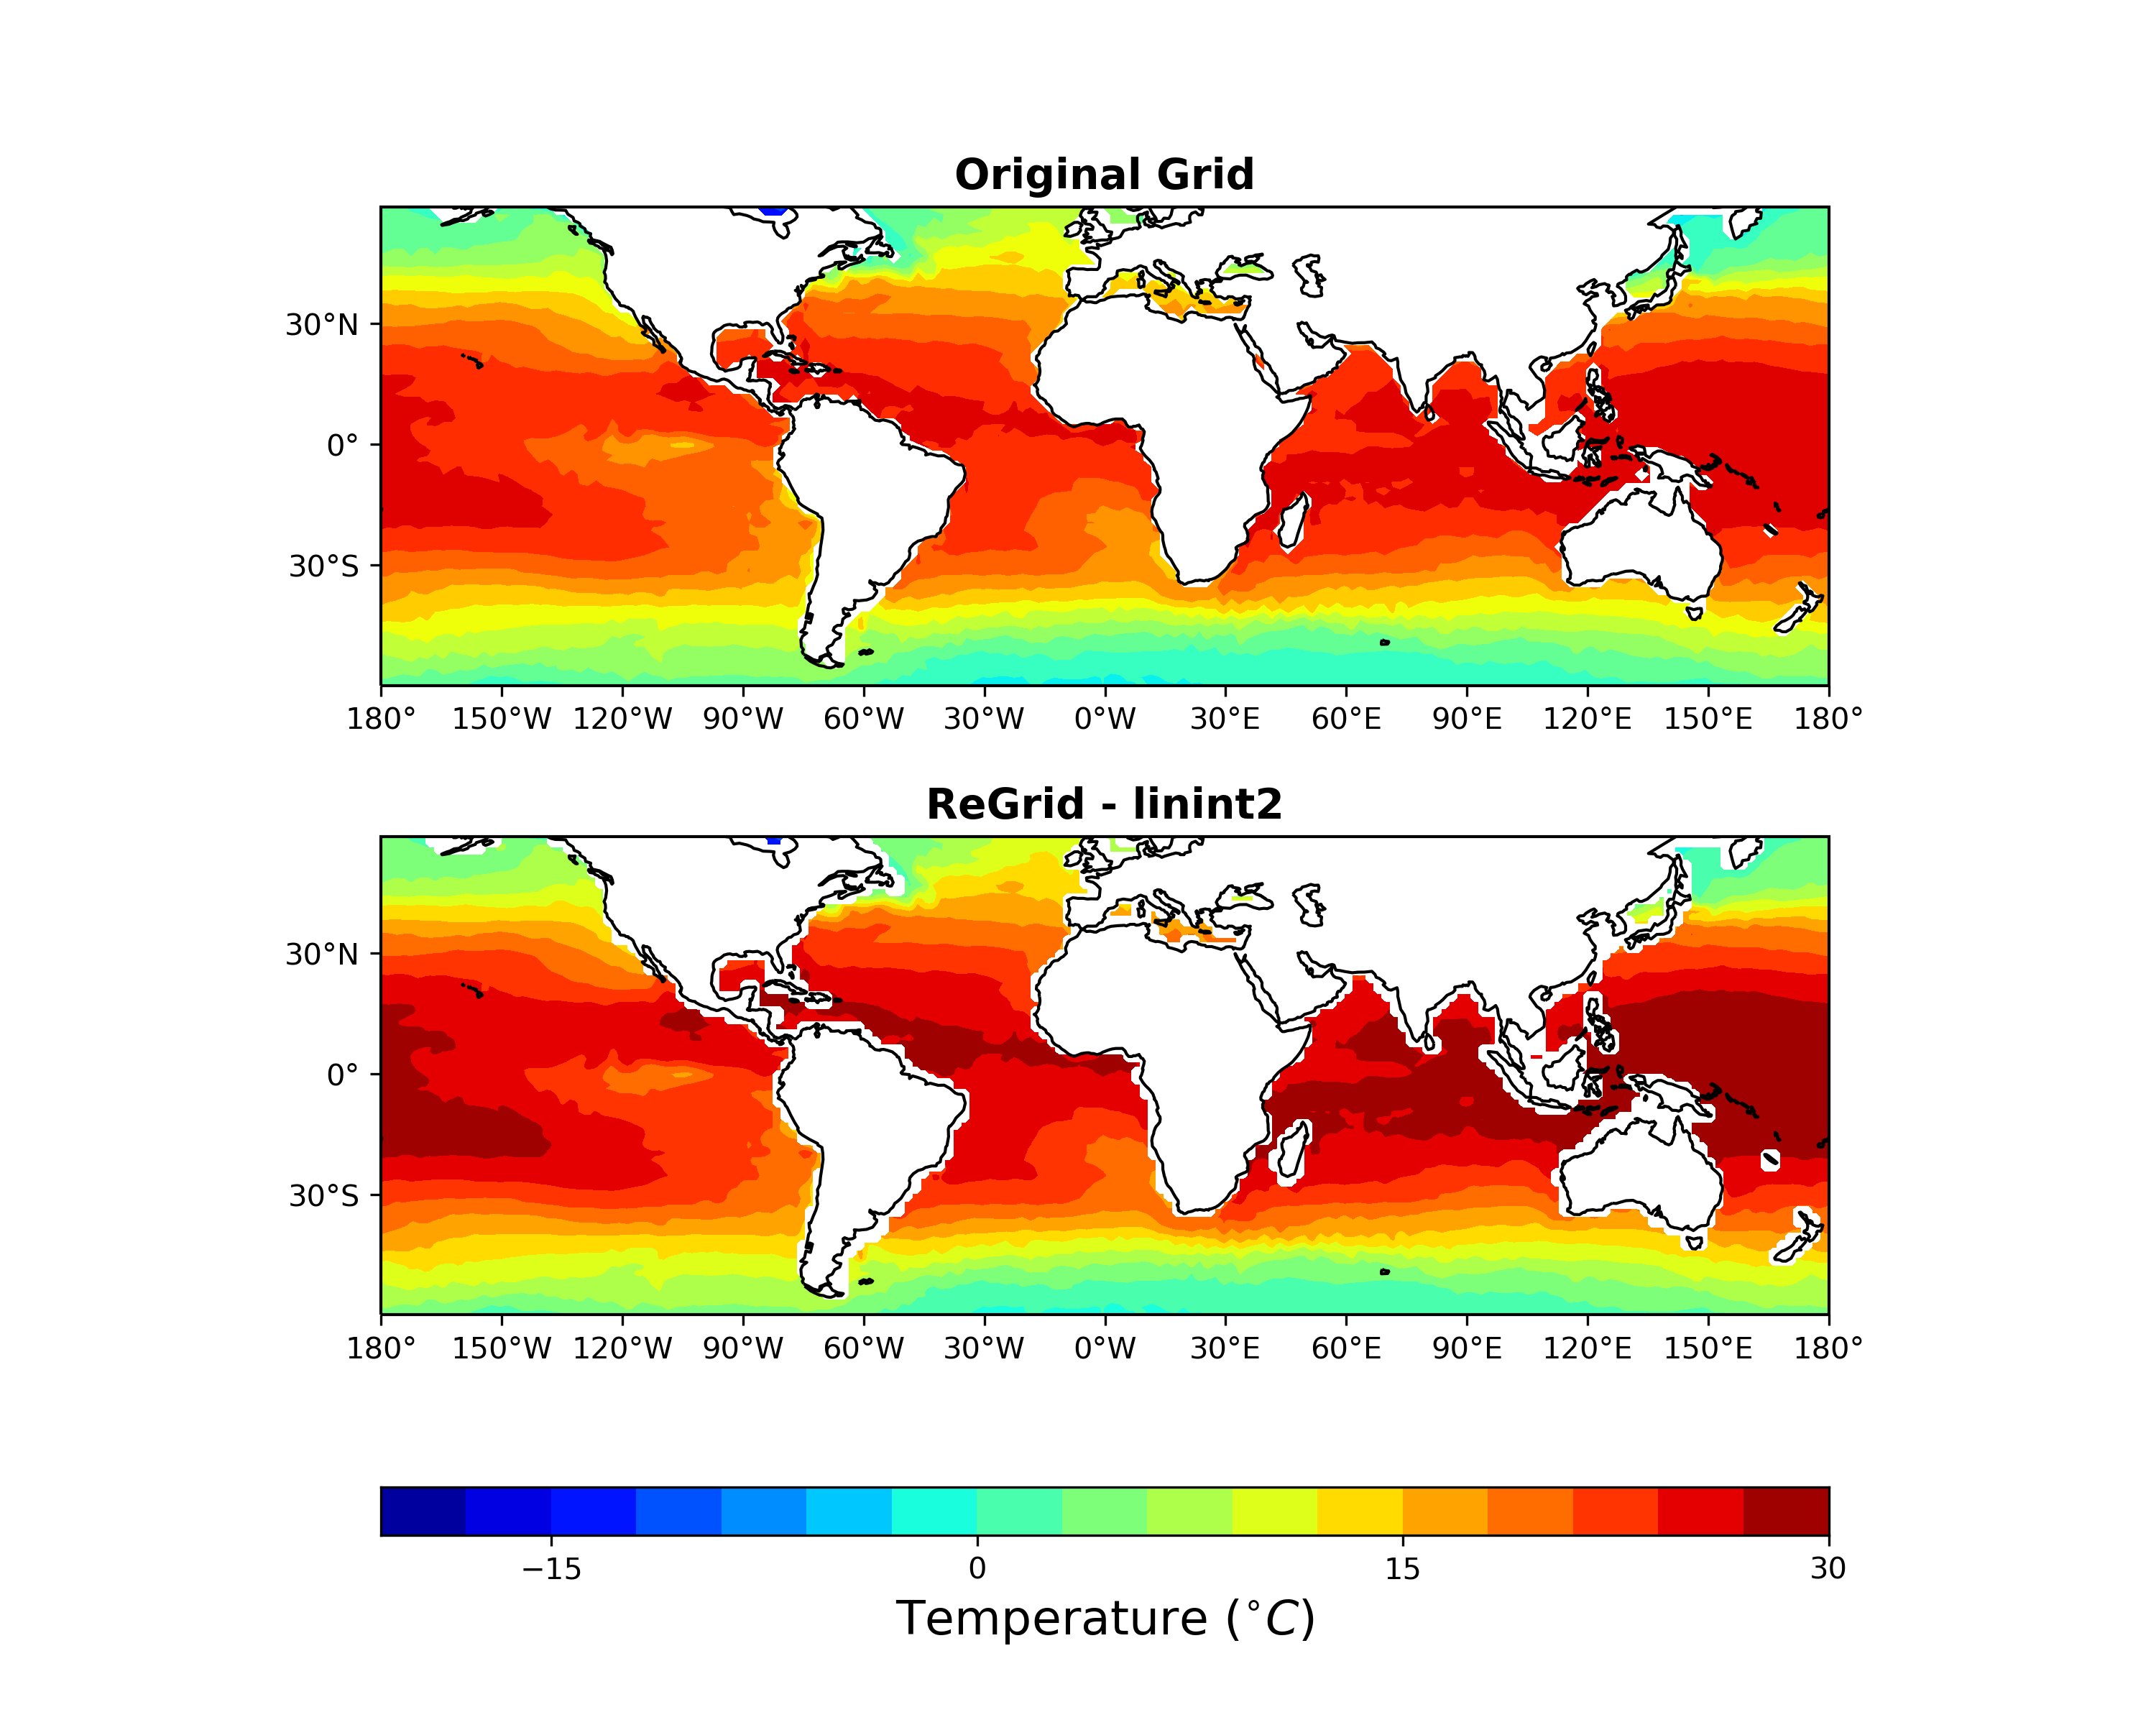
geocat.comp.linint2() example
import numpy as np
import xarray as xr
import geocat.comp
import cartopy.crs as ccrs
import matplotlib.pyplot as plt
from matplotlib import cm
from cartopy.mpl.ticker import LongitudeFormatter, LatitudeFormatter
from cartopy.mpl.geoaxes import GeoAxes
from mpl_toolkits.axes_grid1 import AxesGrid

# Open a netCDF data file using xarray default engine and load the data into xarrays
ds = xr.open_dataset("sst.nc")
sst = ds.TEMP[0,0,:,:]
lat = ds.LAT[:]
lon = ds.LON[:]

# Provide (output) interpolation grid and call `linint2` function from `geocat-comp`
newlat = np.linspace(min(lat), max(lat), 24)
newlon = np.linspace(min(lon), max(lon), 72)

# Invoke `linint2` from `geocat-comp`
newsst = geocat.comp.linint2(sst, newlon, newlat, False)

projection = ccrs.PlateCarree()
axes_class = (GeoAxes, dict(map_projection=projection))
fig = plt.figure(figsize=(10,8))
axgr = AxesGrid(fig, 111, axes_class=axes_class,
                nrows_ncols=(2, 1),
                axes_pad=0.7,
                cbar_location='right',
                cbar_mode='single',
                cbar_pad=0.5,
                cbar_size='3%',
                label_mode='')  # note the empty label_mode

plot_options = dict(transform=projection,
                    cmap=cm.jet,
                    vmin=-30, vmax=30, levels=16, extend='neither', add_colorbar=False, xtitle='')

for i, ax in enumerate(axgr):
    ax.coastlines()
    ax.set_xticks(np.linspace(-180, 180, 13), crs=projection)
    ax.set_yticks(np.linspace(-60, 60, 5), crs=projection)
    lon_formatter = LongitudeFormatter(zero_direction_label=True)
    lat_formatter = LatitudeFormatter()
    ax.xaxis.set_major_formatter(lon_formatter)
    ax.yaxis.set_major_formatter(lat_formatter)

    # Plot contours for both the subplots
    if( i==0 ):
        sst.plot.contourf(ax=ax, **plot_options)
        ax.set_title('Original Grid', fontsize=14, fontweight='bold')
    else:
        p = newsst.plot.contourf(ax=ax, **plot_options)
        ax.set_title('Regrid (to coarse) - linint2', fontsize=14, fontweight='bold')

    ax.xaxis.label.set_visible(False)
    ax.yaxis.label.set_visible(False)

# Add color bar and label details (title, size, etc.)
cax=axgr.cbar_axes[0]
cax.colorbar(p)
axis=cax.axis[cax.orientation]
axis.label.set_text('Temperature ($^{\circ} C$)')
axis.label.set_size(16)
axis.major_ticklabels.set_size(10)

# Save figure and show
plt.savefig('linint2.png', dpi=300)
plt.show()
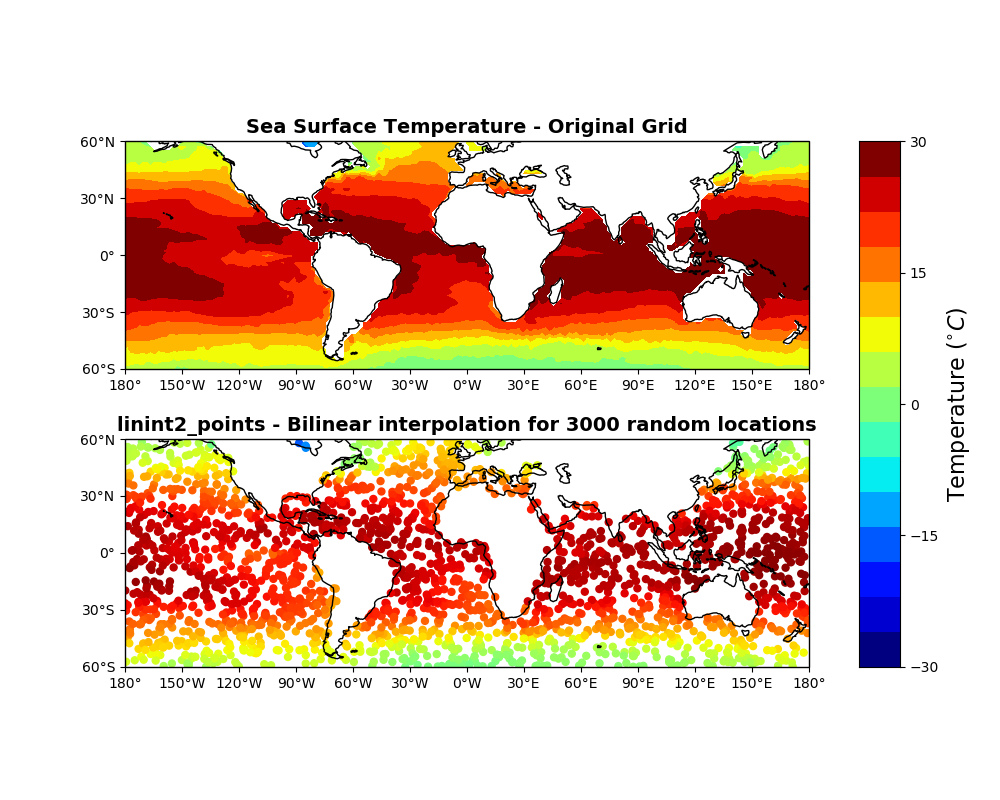
geocat.comp.linint2_points() example